Flux levels of the present Star Tracker CCD
Sam Ragland dated on
The flux levels of the present Star
Tracker CCD are characterized using data from March 2003 (Mira run). Sixty-three
independent measurements taken on seven calibrators, all early K type stars, are used here. Measurements were made
with an integration time of either 10ms or 4ms. Data taken with 4ms integrations
are scaled (by a factor of 2.5) and used with that of ‘10ms integration’.
We find that I magnitude is a better magnitude than V & R magnitudes to
characterize this Star Tracker CCD. Fig. 1 & 2 show plots of observed
Maximum CCD counts as a function of I magnitudes. While
taking one telescope data, shutters corresponding to the other two telescope
beams were closed. Also,
background data has been taken and taken into account.
Assuming that the CCD has linear
response over its dynamical range, the expected fluxes for different
integration times and for a range of I magnitudes are
listed in Table 1.
|
I mag |
Integration time (ms) |
|||||
|
|
4 |
10 |
20 |
30 |
40 |
50 |
|
3.0 |
3105 |
|
|
|
|
|
|
3.5 |
1959 |
|
|
|
|
|
|
4.0 |
1236 |
3090 |
|
|
|
|
|
4.5 |
780 |
1950 |
3901 |
|
|
|
|
5.0 |
492 |
1230 |
2462 |
3691 |
|
|
|
5.5 |
310 |
776 |
1553 |
2329 |
3105 |
3880 |
|
6.0 |
196 |
490 |
980 |
1470 |
1959 |
2448 |
|
6.5 |
124 |
309 |
618 |
927 |
1236 |
1545 |
|
7.0 |
78 |
195 |
390 |
585 |
780 |
975 |
|
7.5 |
49 |
123 |
246 |
369 |
492 |
615 |
|
8.0 |
31 |
78 |
155 |
233 |
310 |
388 |
|
8.5 |
20 |
49 |
98 |
147 |
196 |
245 |
|
9.0 |
12 |
31 |
62 |
93 |
124 |
154 |
|
9.5 |
8 |
19 |
39 |
59 |
78 |
97 |
|
10.0 |
5 |
12 |
25 |
37 |
49 |
61 |
|
10.5 |
3 |
8 |
16 |
23 |
31 |
39 |
|
11.0 |
2 |
5 |
10 |
15 |
20 |
24 |
Table 1: Max. CCD counts as function of I magnitudes for different integration times
Fig.1: Maximum CCD counts are plotted against I magnitudes for all
three telescopes. A least square fit to the data are shown and the best fit parameters are given.
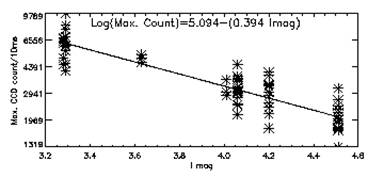
Fig2: Same as figure 1, but all three telescope
values are used together. A least square fit to the data and the best fit parameters
are given.
The slope of the best fit (Fig. 2) is
-0.394, which is close to the expected value of -0.4, suggesting that this calibration is probably independent of the spectral
type of the target. This slope for calibrations based on V magnitude and R
magnitudes (Fig. 3) are respectively -0.299 and -0.353. Strictly speaking,
these (V & R magnitude based) calibrations are good for only early K type
stars. And, targets of later spectral types would have
more counts and earlier spectral types would have less counts.
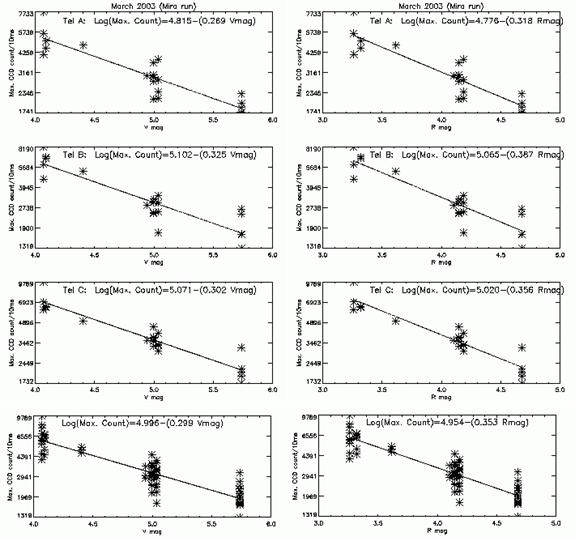
Fig.3: Maximum CCD counts are plotted against
V magnitudes (left) and R magnitudes (right) for all three telescopes. Top
three rows correspond to Telescope A, B & C respectively and the bottom row
shows all three telescope data together.