Data Pipelines for the TRES Echelle Spectrograph
By
Douglas J. Mink
Smithsonian Astrophysical Observatory, Cambridge, MA 02138
Abstract
The Tillinghast Reflector Echelle Spectrograph (TRES) is a two-fiber
(object and sky spectra) optical echelle spectrograph on the
1.5-meter Tillinghast telescope at the Smithsonian Astrophysical
Observatory's Fred L. Whipple Observatory on Mt. Hopkins in Arizona.
An IRAF-based processing pipeline has been written to reduce spectra
keeping the maximum wavelength precision, which varies from 0.03 to
0.07 Angstroms/pixel over 51 orders covering a range of 3850 to
9100 Angstroms. A major design goal was to use the same software
at the telescope for quick-look real-time processing and, with
relatively few parameter changes, reduction with more accuracy for
scientific processing. A modular system was written in IRAF for
portability and simplicity, so that scientists can re-reduce
their data in various ways to optimize its quality for their needs.
IRAF tasks developed for the SAO FAST long-slit and Hectospec
multi-fiber spectrographs, as well as NOAO-developed echelle tasks,
were adapted for this instrument.
The TRES Spectrograph
The Tillinghast Reflector Echelle Spectrograph (TRES)
(
(Szentgyorgyi & Furesz 2007)
is a two-fiber (object and sky spectra) echelle spectrograph on the
1.5-meter Tillinghast telescope at the Smithsonian Astrophysical
Observatory's Fred L. Whipple Observatory on Mt. Hopkins in Arizona.
It covers optical and near-IR wavelengths from 3850 to 9100 Angstroms
at a resolution which varies from 0.03 to 0.07 Angstroms/pixel over
the spectrograph's 51 orders.
Design Strategy
Our two design goals were to keep the maximum wavelength precision
and to use the same software for both quick-look processing at the telescope
and more accurate processing for scientific analysis.
To maintain accuracy, we fit a two-dimensional (order and pixel)
dispersion function to each spectrum and maintain that function in
the header through further processing using formats developed in IRAF
for dealing with multi-order echelle data. Using IRAF made it possible
to adapt and re-use tasks written to process data from other SAO
spectrographs such as FAST
(Tokarz& Roll 1997)
, Hectospec
(Mink et al 2005;
(Mink et al 2007)
and Hectochelle, as well as IRAF tasks written at NOAO
(Valdes 1992),
which process images and extract multiple-order
Echelle spectra. For portability, all code is written in IRAF CL or SPP.
Data Structure
The process needed to be easy enough for scientists to use and even harder
for them to misuse. This was accomplished by keeping all processed
data in a different directory than raw data and enforcing that separation
in code.
Each night's raw data resides in a directory designated by
[rawdir]/yyyy/yyyy.mmdd, with filenames beginning with a three-digit
sequence number, followed by an object name or calibration type (BIAS, DARK,
FLAT, or COMP). These filenames are kept through all processing.
Corresponding processed data is in a directory
[procdir]/yyyy/yyyy.mmdd. When composite files, such as sums and
medians, are created, they are automatically given sequence numbers beyond
those used for observed data.
Data Processing
One master IRAF CL script, tproc, runs the entire data processing
pipeline. In the past, while processing data from other instruments, it
has been difficult to work with IRAF scripts which called one master program
with different arguments to do different processing steps. When tasked
with writing a multiple purpose pipeline, however, it became apparent
that having one main program made it easier to process all of the different
data types identically. It works on a single spectrum or a group of spectra
of the same object with the same fiber configuration and exposure time.
First, the standard IRAF ccdproc task is used to remove the bias levels
from the overscan region of the chip and trim that region from the image
file. Then the two amplifiers are corrected to the same gain and merged
into a single image. Bad pixels are fixed in that merged and trimmed image
because they can only be discovered in images
combined to remove the many bright spots caused in each image by radiation
from the anti-reflection coating on the dewar window. Each image is then
corrected by the aperture flattening image to minimize fringing and pixel
to pixel variation. If a median image is requested, it is made next, before
particle hits and cosmic rays are removed from a group of similar images
by a locally-written task which intercompares them. At this point a sum of
all of the similar images may be made and added to the processing list along
with a requested median file. Then a model of the scattered light is fit to
the background of each image, with the spectrum or spectra masked out, and
subtracted.
For ThAr wavelength calibration and flat field lamps, one spectrum is
then extracted from each image. For object plus sky images, two spectra
are extracted. Thorium Argon (ThAr) wavelength
calibration spectra are compared to a reference spectrum, and a wavelength
to pixel mapping is fit for each one. For each object or sky spectrum,
wavelength solutions are found by combining the closest or most recent ThAr
solutions. If the simultaneous sky spectrum is going to be removed from the
object spectrum, it is first rebinned to the same wavelength solution as the
object spectrum, and then corrected for fiber throughput before being
subtracted.
Processing Data
Initalization
To make the separation of raw and processed data easy, the
trsdate yyyy.mmdd
command sets the processing and raw data directories based on the date.
After this, all of the tasks can find the raw data and put the processed
data only in the processing directory. Tasks that write data always check
to make sure that they are writing to the processing directory.
Quick Look
qtres reduces one raw spectrum image to one to three multi-order
echelle spectra using \textbf{tproc}. Default flat fields and ThAr spectra
can be used because night-to-night instrumental shifts are less than
a pixel.
Quick Look with Cosmic Ray Removal
ctres is a quick-look task for multiple images with the same
configuration reducing a list of raw spectrum images to dispersion-
corrected multi-order echelle spectra with cosmic rays removed by
tcosmic.

|

|
|
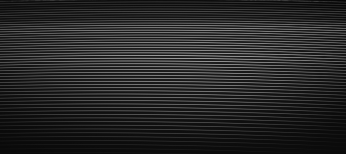
Figure 1. Processed flat field and ThAr images
|
Setting Up and Processing a Full Night's Data
trsgroup makes lists all of the TRES files to be processed,
grouped by object name, fiber configuration and exposure time
\textsl{[obj][s m l][b if binned][fiber(s)]x[exposure in seconds].list}.
Multiple groupings of exposures of the same object and configuration
are split into separate lists. A master list of lists is made for
object data. Processing then proceeds with optional interaction.
btres processes and takes the median of all bias images
(those with BIAS as the object name), plotting a histogram of
the combined image as an instrument check.
If dark field images are taken, dtres makes a median of all of them
and plots a histogram of the combined image as an instrument check.
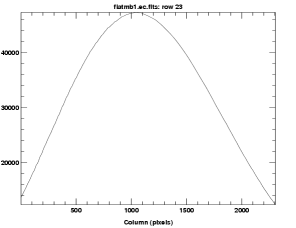
Images of flat field spectra (with FLAT as the object name) are used
to create extraction functions, aperture flattening masks, scattered
light masks, and throughput ratios. ftres is run on lists
of short-exposure images from each fiber for each observation configuration,
creating the necessary masks and functions.

|

|
|
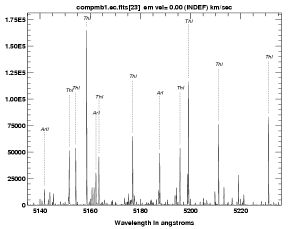
Figure 2. Single order of extracted flat field and ThAr spectra
|
Thorium Argon spectra (with COMP as the object name) are processed using
ttres, which reads a list of raw ThAr spectrum images taken with
the same fiber size and binning and extracts them to dispersion-corrected
multi-order echelle spectra. Each extracted spectrum (see figure 1) is
cross-correlated to a reference spectrum in pixel space
using rvsao.xcsao
(Kurtz & Mink 2998)
The resulting pixel shift is added to the line positions in the
reference spectrum database file which is then refit to the lines identified
in the ThAr spectrum.
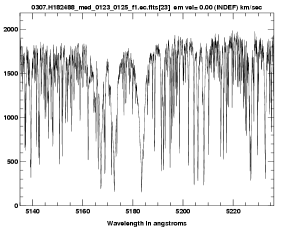
Object spectra are then processed by the trsproc task which
runs otres on each list of similar object observations read from
the list file created by \textbf{trsgroup}.

|

|
|
Figure 3. Raw stellar spectrum and one order of extracted spectrum
|
Acknowledgements
I would like to thank Gabor Furesz for designing the instrument and suggesting
processing possibilities, Lars Buchave and Dave Latham for suggesting
additional processing steps, Nathalie Martimbeau and Perry Berkind for
using the pipeline and suggesting improvements, and Susan Tokarz for
helping me clarify this description of how the pipeline works.
Bibliography
-
Kurtz, M. J., & Mink, D. J. 1998, PASP, 110, 934.
-
Mink, D. J., Wyatt, W. F., Caldwell, N., Conroy, M. A., Furesz,
G., & Tokarz, S. P. 2007, in Astronomical Data Analysis Software and Systems XVI, edited by R.
A. Shaw, F. Hill, & D. J. Bell, vol. 376 of Astronomical Society of the Pacific Conference Series, 249
-
Mink, D. J., Wyatt, W. F., Roll, J. B., Tokarz, S. P., Conroy, M. A., Caldwell,
N., Kurtz, M., Geller, M. J., & et al. 2005, in Astronomical Data
Analysis Software and Systems XIV, edited by P. Shopbell, M. Britton, & R. Ebert, vol. 347 of Astronomical Society of the Pacific Conference Series, 228
-
Szentgyorgyi, A. H., & Fur´esz, G. 2007, in Revista Mexicana de Astronomia y Astrofisica Conference Series, edited by S. Kurtz, vol. 28 of Revista Mexicana de Astronomia y Astrofisica Conference Series, 129
-
Tokarz, S. P., & Roll, J. 1997, in Astronomical Data Analysis Software
and Systems VI, edited by G. Hunt & H. Payne, vol. 125 of Astronomical Society of the Pacific Conference Series, 140
-
Valdes, F. 1992, in Astronomical Data Analysis Software and Systems I,
edited by D. M. Worrall, C. Biemesderfer, & J. Barnes, vol. 25 of Astronomical Society of the Pacific Conference Series, 417
Presented at the Twentieth Annual Conference on Astronomical Data Analysis
Sofware and Systems (ADASS XX)
in Boston, Massachusetts, November 7-11, 2010
Use this Reference:
Douglas J. Mink, 2011, in Astronomical Data Analysis Software and Systems XX,
ASP Conference Series, Vol. xxx, Edited by I. Evans, A. Accomazzi, D. Mink,
and A. Rots, San Francisco: Astronomical Society of the Pacific, p. xxx


