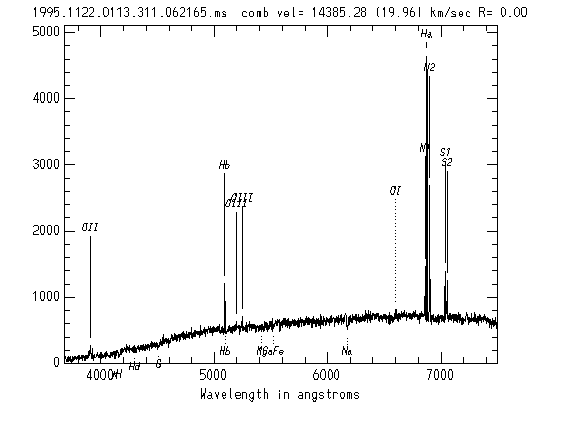
This display of the entire spectrum, with all found emission lines and all
possible absorption lines labelled is produced if
dispmode is 3.

[summary graph]
[whole spectrum]
[Ca H and K]
[H beta]
[Na]
[H alpha]
[emsao log]
Click on graph to remove continuum
